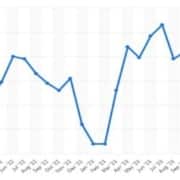
Oil prices have recorded the biggest weekly decline in three months thanks in large part to challenging economic indicators and growing demand concerns. Last week, U.S. crude inventories posted an unexpected rise, with the American Petroleum Institute (API) reporting a build of 4.91 million barrels, a sharp contrast from the anticipated decrease of 1.1 million barrels. This build has come after reports that U.S. crude production surged to 13.15 million barrels per day in February, up from 12.58 million barrels in January, suggesting supply is outpacing demand.
But it’s not just bearish crude oil metrics driving the oil price decline. The EIA has provided an initial estimate that U.S. gasoline demand declined 4.4% Y/Y in April, a negative sign for oil bulls that has triggered a rapid pivot by speculative funds towards the short side of the market. However, commodity analysts at Standard Chartered have argued that the demand pessimism is overblown. According to StanChart, there appears to be a systemic downwards bias in the weekly estimates of U.S. fuel demand, with actual gasoline demand exceeding estimates in 22 of the past 24 months, while distillate demand (mainly diesel) has been revised higher in all of the past 24 months. The analysts point out that last September, the EIA put gasoline demand at 8.014 million barrels per day (mb/d), a stark contrast from the 9.465 mb/d recorded for in September 2022. Across the whole month, the EIA data implied a y/y demand drop of 5.6%, eliciting talks of demand destruction with some experts contending that demand was at its weakest since 1999. However, it later turned out that actual gasoline demand only fell 0.4% Y/Y, far milder than the EIA estimate of a 5.6% decline. StanChart believes the EIA’s estimate for April gasoline demand is too low with actual demand likely to be surprise to the upside.
Click here to read the full article
Source: Oil & Gas 360
—
If you have any questions or thoughts about the topic, feel free to contact us here or leave a comment below.


